
Science
Your birthday isn’t your only age
The science of chronological age vs. biological age.
Think of two people you’ve known for years who are exactly the same age. One of them barely seems to have changed in a decade. The other looks, and moves, and gets sick, like someone considerably older. Same number of birthdays. Very different bodies.
That gap is what this page is about, and it starts with getting clear on the number most of us have never questioned: the one on a birth certificate.
What is chronological age?
Chronological age is simple: it’s the number of years that have passed since you were born. It’s fixed. It’s the same for everyone born on the same day, and nothing you do changes it.
What chronological age doesn’t do, is tell you anything about the actual condition of your body: how well your cells are repairing themselves, how your organs are functioning, or how quickly you’re heading towards age-related disease.
What is biological age?
Biological age gets at that second thing: the actual state of your body’s ageing processes, separate from the calendar. It’s an estimate rather than a fixed fact like chronological age, and it’s built from measurable signals in your body instead of your birth date.
Why the distinction is worth caring about: if biological age tracks things like disease risk and physical decline more closely than the number of birthdays does, it’s simply a more useful number to work with, for you and for whoever’s helping you read it.
Why the two can diverge
Ageing isn’t one clock ticking at the same speed for everyone. It’s a build-up of small changes deep in your cells, including in how genes get switched on and off, shaped over time by your genes, your environment, and how you live. One of the best-studied examples is DNA methylation: small chemical tags that attach to spots on your DNA over a lifetime. Think of them as pencil notes in the margins of a book. They don’t change the printed words, but they build up in patterns, and those patterns shift as the book gets read and handled over the years. Two people can be the exact same age on paper and have very different amounts of this wear written into the margins.
Biological age isn’t one number for your whole body
So far, this page has talked about biological age as a single number that differs between people. But the same idea applies within one person, too, and it applies at more than one level of the body at once.
Ageing shows up in layers: change starts at the molecular level (DNA, proteins, metabolism), accumulates differently across your cells and tissues, forms distinct patterns across whole organs and physiological systems, and only then adds up into an overall whole-body estimate. Your cardiovascular system, kidneys, immune system, and brain can each be ageing at somewhat different rates within the same body, shaped by genetics, environment, and how each system has been used and stressed over your life. Someone’s heart can show signs of faster-than-expected ageing while their kidneys look comparatively younger, both readings can be true at once; they aren’t a contradiction. Two people can even land on the exact same overall biological age score while having very different patterns underneath it, one ageing faster in the cardiovascular system, the other in the immune system, for instance.
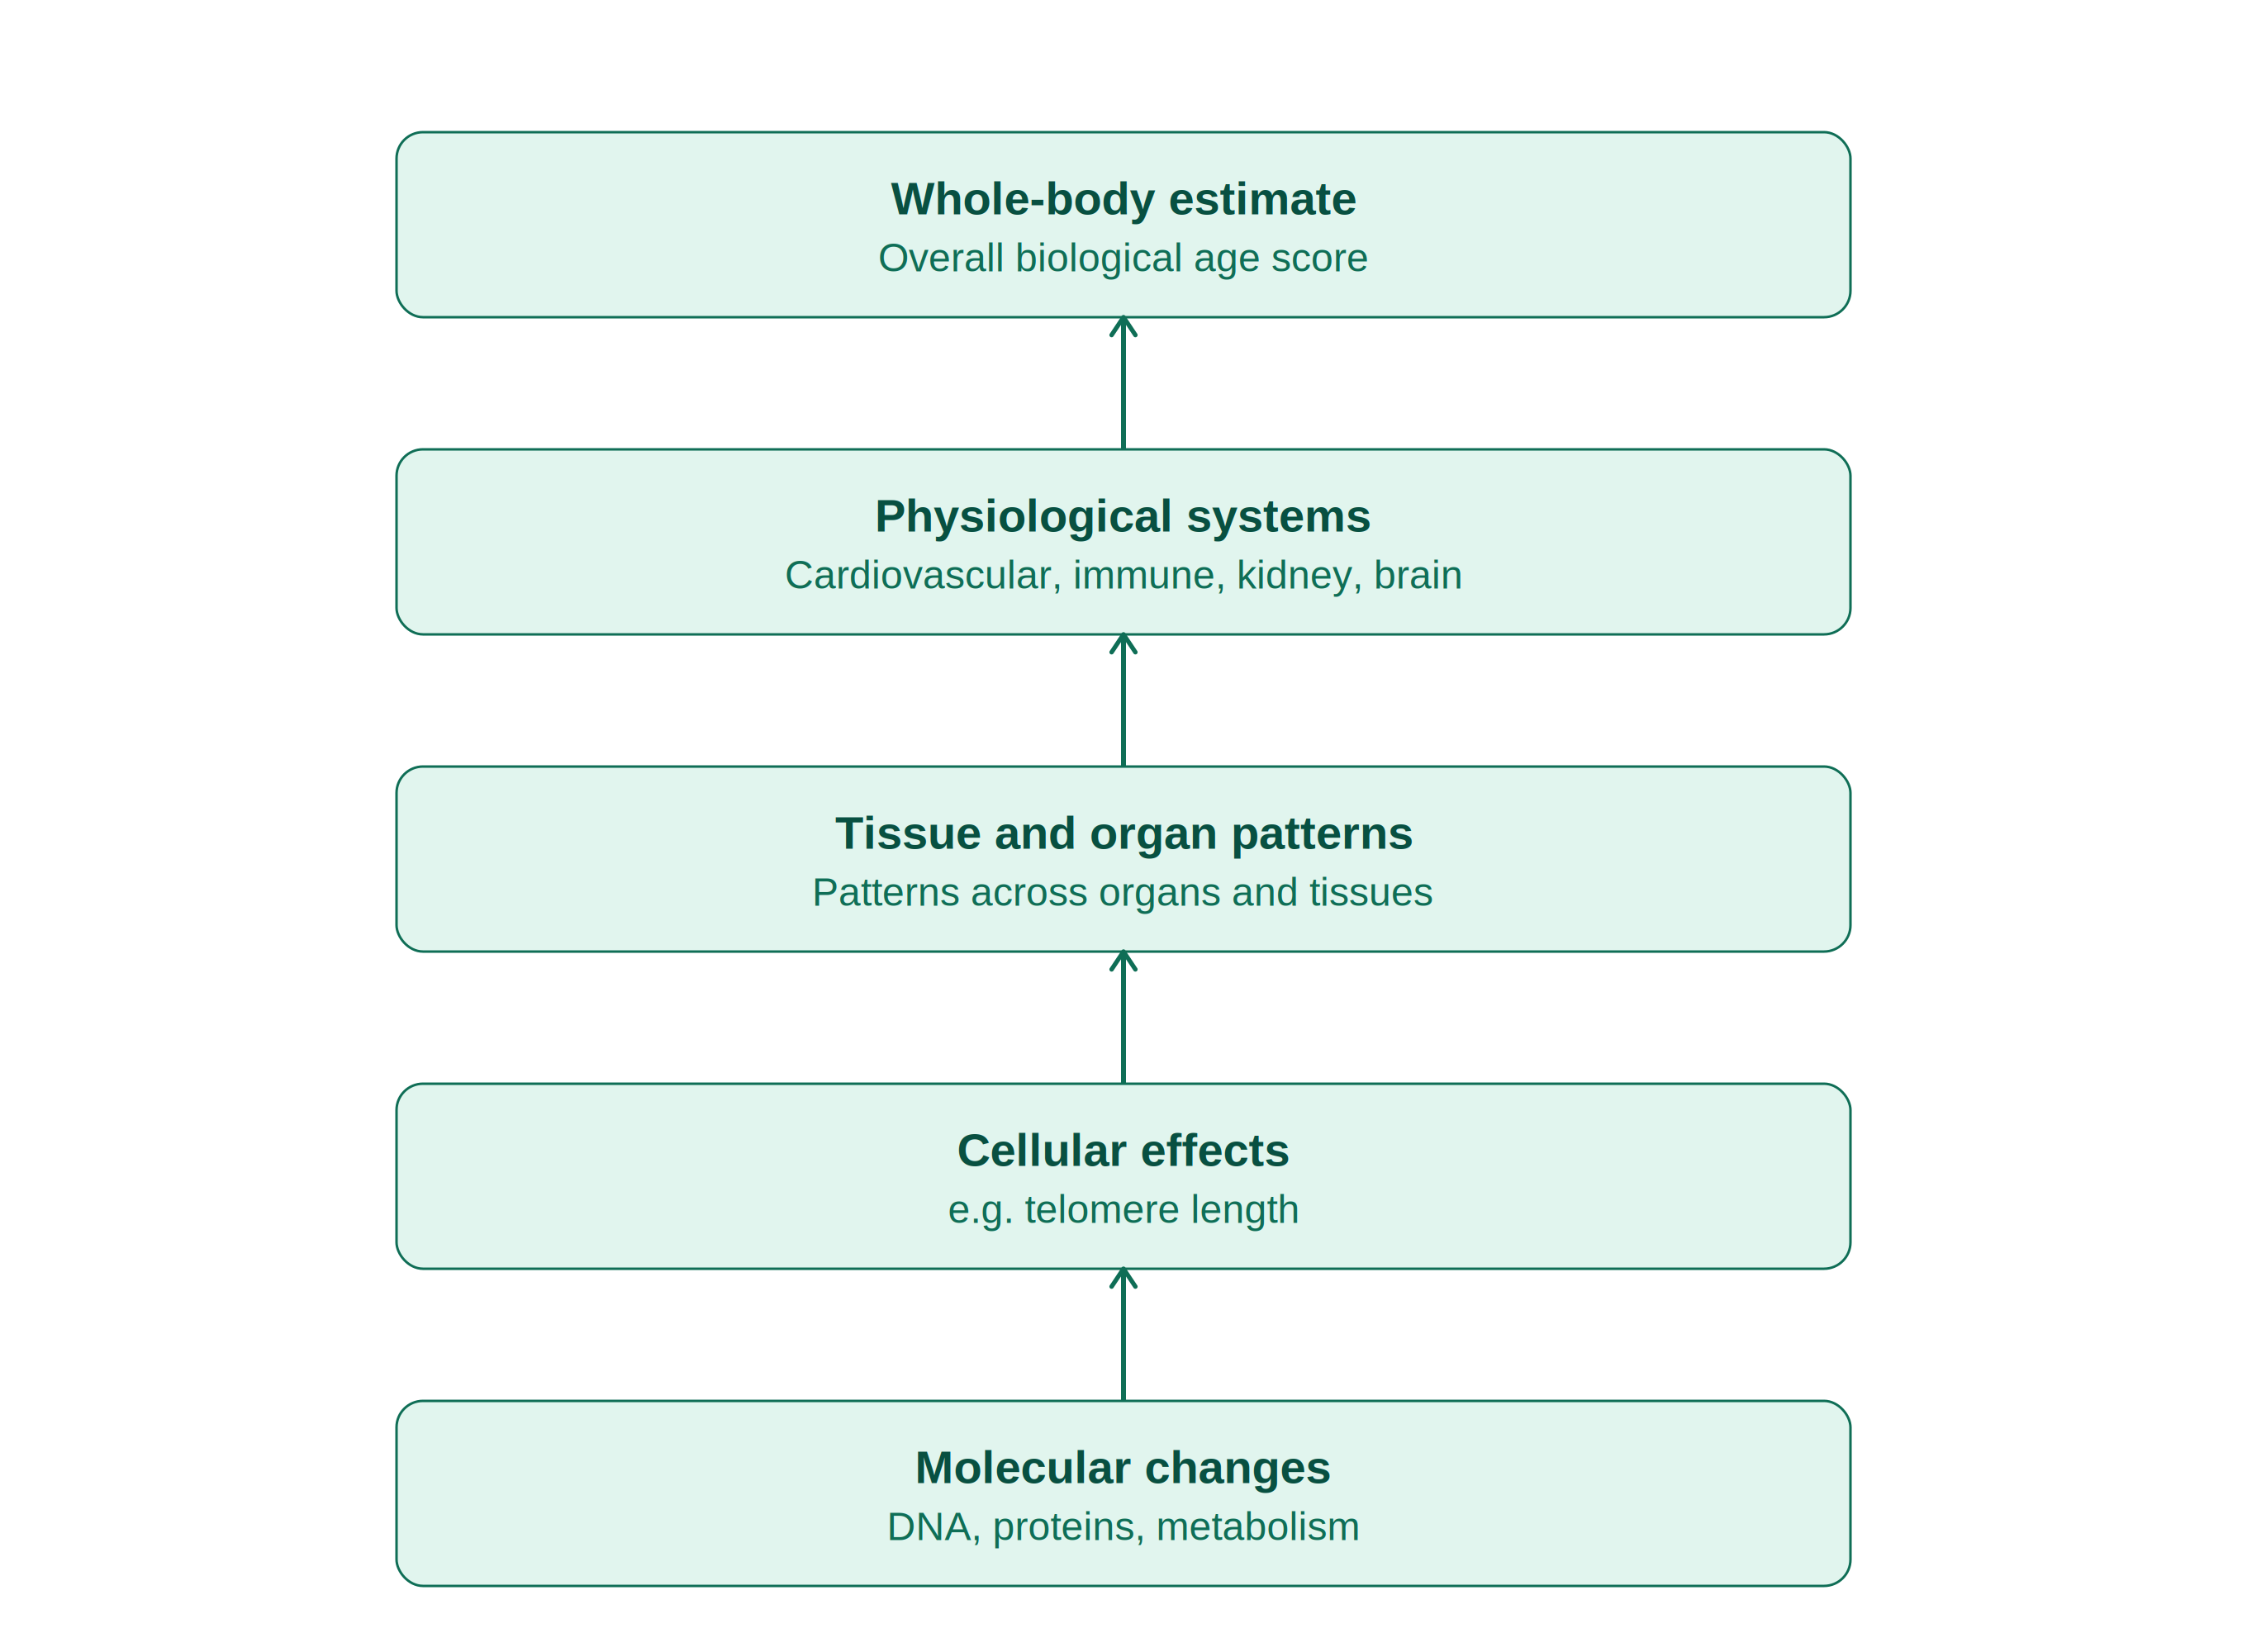
Diagram showing biological ageing building up across five levels: molecular changes, cellular effects, tissue and organ patterns, physiological systems, and a whole-body estimate.
This is exactly why one of TMRW’s three clocks, SymphonyAge, reports on eleven separate physiological systems instead of one overall number. The pattern across systems tells you something a single score can’t: where the ageing is actually showing up.
How is biological age actually measured?
There isn’t one agreed way to measure biological age. Researchers have built several different approaches, and each one reads a different layer of the body, not just a sharper or blurrier take on the same signal:
- Molecular layer. DNA methylation (“epigenetic clocks”), transcriptomic clocks, and proteomic/metabolomic clocks.
- Cellular layer. Telomere length, the protective caps on the ends of chromosomes, which shorten over time.
- Organ and whole-body layer. Composite clinical biomarker scores and deficit-accumulation (frailty) indices.
- Specific-organ layer. Imaging-based methods, such as brain or retinal age.
For the same person, these approaches don’t always land on the same answer. That’s not a flaw, it’s what you’d expect: two methods can both be right and still differ, because they’re reading different rungs of the same ladder.
Of this group, DNA methylation is the most extensively studied and most widely used in clinical research so far, which is why it’s the layer covered next.
Why TMRW uses epigenetic and multi-omic clocks
With so many options on the table, why build TMRW’s testing on epigenetic and multi-omic clocks specifically, rather than one of the other categories? A few reasons.
Epigenetic clocks are the most extensively studied and most widely used in clinical research to date. Of the approaches mentioned above, DNA methylation-based clocks have the most published population-level evidence linking them to disease risk and mortality, including the trajectory evidence discussed below. They’re also the category most registered longevity trials have used so far.
That’s a claim about volume and current practice, not a ranking. No agreed benchmark comparing all these categories head-to-head exists yet, and no ageing biomarker, in any category, has been formally accepted as a stand-in for a real health outcome. Telomere length was an earlier contender, but it doesn’t line up closely with methylation-based estimates and hasn’t built the same depth of evidence. The rest are either earlier-stage or built for a narrower job, a single organ, or a research setting, rather than general-purpose testing.
Standard clinical biomarkers are covered elsewhere, not skipped. TMRW’s own biomarker panel already handles that layer, using a wider set of markers than a standard blood test. Epigenetic clocks add something bloods can't see on their own: a read on how your genes are being regulated, not just what's currently circulating in your blood.The two aren’t competing, they’re parts of the same picture.
Three clocks, not one, because they capture different things. TMRW uses three independently developed clocks together, not as alternatives to pick between: SymphonyAge, OMICmAge, and DunedinPACE. Two of them, SymphonyAge and DunedinPACE, run on DNA methylation alone. OMICmAge is the outlier: it’s multi-omic, trained on proteomic, metabolomic, and clinical data as well as methylation, so it draws on a wider range of biological signals.
Because ageing doesn’t move at the same rate across your body, TMRW keeps these three scores separate rather than blending them into one figure. A single combined number would hide the very differences that make each clock worth having.
- SymphonyAge estimates ageing across eleven distinct physiological systems (heart, lung, kidney, and others) rather than a single whole-body number.
- DunedinPACE measures the current pace at which someone is ageing, rather than an age estimate itself, and has evidence from a randomised controlled trial (the CALERIE study) that this pace responds to a real intervention in humans. Think speedometer, not odometer: it reads how fast you’re moving now, not the distance already behind you.
- OMICmAge is a multi-omic clock: alongside methylation, its model was trained on proteomic, metabolomic, and clinical data. Worth being clear on what that does and doesn’t mean. For you, it’s still one blood draw and one methylation-based test. The extra omics data shaped how the model was built in the first place, it isn’t measured again every time you test. Its evidence so far is observational rather than from trials, and its validation used a TruDiagnostic-run group, flagged here the same way we note SymphonyAge’s TruDiagnostic ties.
Each clock has its own dedicated page with the full detail on its methodology, evidence base, and what its score does and doesn’t tell you: SymphonyAge · OMICmAge · DunedinPACE.
What the evidence actually shows
This is where it’s worth being precise, because the strength of the evidence depends on what kind of claim is being made.
At the population level, the evidence for epigenetic clocks specifically is strong: people whose epigenetic age estimate is accelerating faster than their chronological age face measurably higher risk of age-related disease and mortality. One well-powered study following adults for up to 24 years found that the rate of change in epigenetic age over time predicted mortality risk independently of a person’s starting point.
That last detail matters for how to read your own results. A single reading tells you something, the way a single temperature reading tells you something. But the direction of change across repeated tests tells you something more reliable, the way tracking a fever over 48 hours tells you more than one reading does. This isn’t fine print. It’s the thing to keep in mind every time you look at one of these numbers.
Reading your result: one score vs. a trend
Every measurement carries some noise, and this one is no exception. Research on epigenetic clocks has found that repeat tests on the exact same sample can come back with different results, sometimes by enough to mask a smaller, real change underneath.
So a single result is a starting point, not a verdict. Its value grows as the readings stack up over time, which is why TMRW won’t hand you one number and call it your “true” biological age. Any single estimate has some wobble. The signal is in the trend.
The signal is in the trend, not in any single score.
Beyond the number: why TMRW measures this at all
Most check-ups are built to catch disease once it’s already showing, when symptoms turn up or a blood panel crosses a line. By then, whatever’s happening has been underway for a while. Biological age tracking looks earlier, at the quiet stretch where things have started shifting under the surface but nothing’s tripped an alarm yet.
That’s the whole idea behind how TMRW works: read biological age as a trend, with a clinician, to catch where you’re heading early enough to do something about it. That’s also why it’s built as a membership rather than a one-off test, retested through the year, so the trend is something you watch, not a number you get once and forget.
It’s only fair to say this is contested. The field is young, and credible voices, including one cited below, argue today’s tests tell researchers more about populations than they tell any one person from a single result. We think that’s exactly right, which is why this whole page leans on trend over time and a clinician’s read, never a single score as a verdict. The approach exists because of that critique, not in spite of it.
Common questions
Can you lower your biological age?
Possibly, and that’s the interesting part. Unlike your birthday, this number isn’t fixed. It shifts with things like sleep, activity, nutrition and stress, and in a randomised trial (CALERIE), one measure of the pace of ageing slowed in response to a real change in habits. No single result is a promise. But the trend over time, read with a clinician, shows whether the changes you’re making are moving the number the way you want.
How accurate are biological age tests?
Informative, not exact. Every biological measurement carries some noise, and repeat tests on the same sample can come back slightly different. That’s why a single reading is best treated as a starting point rather than a verdict, and why the value builds as readings stack up. The trend is more reliable than any one number.
Is biological age the same as an epigenetic clock?
Not quite. Biological age is the broad idea: an estimate of how far along your body’s ageing is, separate from the calendar. An epigenetic clock is one way to estimate it, by reading chemical tags on your DNA (methylation). It’s the most studied method so far, which is why TMRW’s testing is built on it, but it’s one approach among several.
How is biological age measured?
At TMRW, from a single blood draw. The lab reads DNA methylation, the tags that build up on your DNA over time, and runs it through three independently developed clocks: SymphonyAge, OMICmAge and DunedinPACE. Each reads ageing a little differently, so you get a fuller picture than any one score alone.
What can a biological age result actually tell me?
A read on how your body is tracking, and, more usefully, which direction it’s heading over time. It can point to where ageing may be showing up earlier than a standard check-up would catch. It doesn’t diagnose disease. Testing informs clinical assessment, and your results are reviewed with a TMRW clinician who helps you decide what, if anything, to do next.
Testing informs clinical assessment and is not a stand-alone diagnosis. Results are reviewed with a TMRW clinician.
Citations
Primary sources (peer-reviewed research, directly support specific claims)
- Sehgal, R., Markov, Y., et al. “Systems Age: a single blood methylation test to quantify aging heterogeneity across 11 physiological systems.” Nature Aging, 5(9), 1880–1896 (2025). PMID 40954326. pubmed.ncbi.nlm.nih.gov/40954326
- Chen, Q., et al. “OMICmAge quantifies biological age by integrating multi-omics with electronic medical records.” Nature Aging (2026). DOI: 10.1038/s43587-026-01073-7. nature.com/articles/s43587-026-01073-7
- Waziry, R., et al. “Effect of long-term caloric restriction on DNA methylation measures of biological aging in healthy adults from the CALERIE trial.” Nature Aging (2023). PMC10148951. ncbi.nlm.nih.gov/pmc/articles/PMC10148951
- Marioni, R. E., et al. “The epigenetic clock and telomere length are independently associated with chronological age and mortality.” PMC4864882. ncbi.nlm.nih.gov/pmc/articles/PMC4864882
- Kuo, P-L., et al. “Longitudinal changes in epigenetic clocks predict survival in the InCHIANTI cohort.” Nature Aging (2026). DOI: 10.1038/s43587-026-01066-6. nature.com/articles/s43587-026-01066-6
- “Using a frailty index based on deficit accumulation.” PMC6183726. pmc.ncbi.nlm.nih.gov/articles/PMC6183726
- “Human brain cell-type-specific aging clocks based on single-nuclei transcriptomics.” PMC12631854. ncbi.nlm.nih.gov/pmc/articles/PMC12631854
- “Longitudinal fundus imaging and its genome-wide association analysis provide evidence for a human retinal aging clock.” eLife (2023). PMC10110236. ncbi.nlm.nih.gov/pmc/articles/PMC10110236
- “MRI-based multi-organ clocks for healthy aging and disease assessment.” Nature Medicine (2025). nature.com/articles/s41591-025-03999-8
- Higgins-Chen, A. T., et al. “A computational solution for bolstering reliability of epigenetic clocks: implications for clinical trials and longitudinal tracking.” Nature Aging (2022). PMID 36277076. pubmed.ncbi.nlm.nih.gov/36277076
- Moqri, M., et al. “Biomarkers of aging for the identification and evaluation of longevity interventions.” Cell, 186, 3758–3775 (2023). cell.com/cell/fulltext/S0092-8674(23)00857-7
- “ComputAgeBench: Epigenetic Aging Clocks Benchmark.” bioRxiv preprint (2024). biorxiv.org/content/10.1101/2024.06.06.597715
Background sources
- TruDiagnostic. “Epigenetic laboratory TruDiagnostic launches first ever organ-specific aging analysis from Yale-developed SYMPHONYAge algorithms.” PR Newswire (2024).
- “Biological age tests reveal what slows or hastens aging, but they’re useful only for researchers, not consumers.” The Conversation (2026). Cited above as the critique this page’s trend-based, clinician-interpreted approach is responding to.